Convert Messy Data to Meaningful Insights in Seconds
Turn uploaded Excel and CSV files into clean, interactive dashboards—instantly.No setup, no formulas, no data expertise required.
Upload and analyzefor free
Drag and drop your file here, or click to browseSupported: CSV, Excel (.xls, .xlsx)

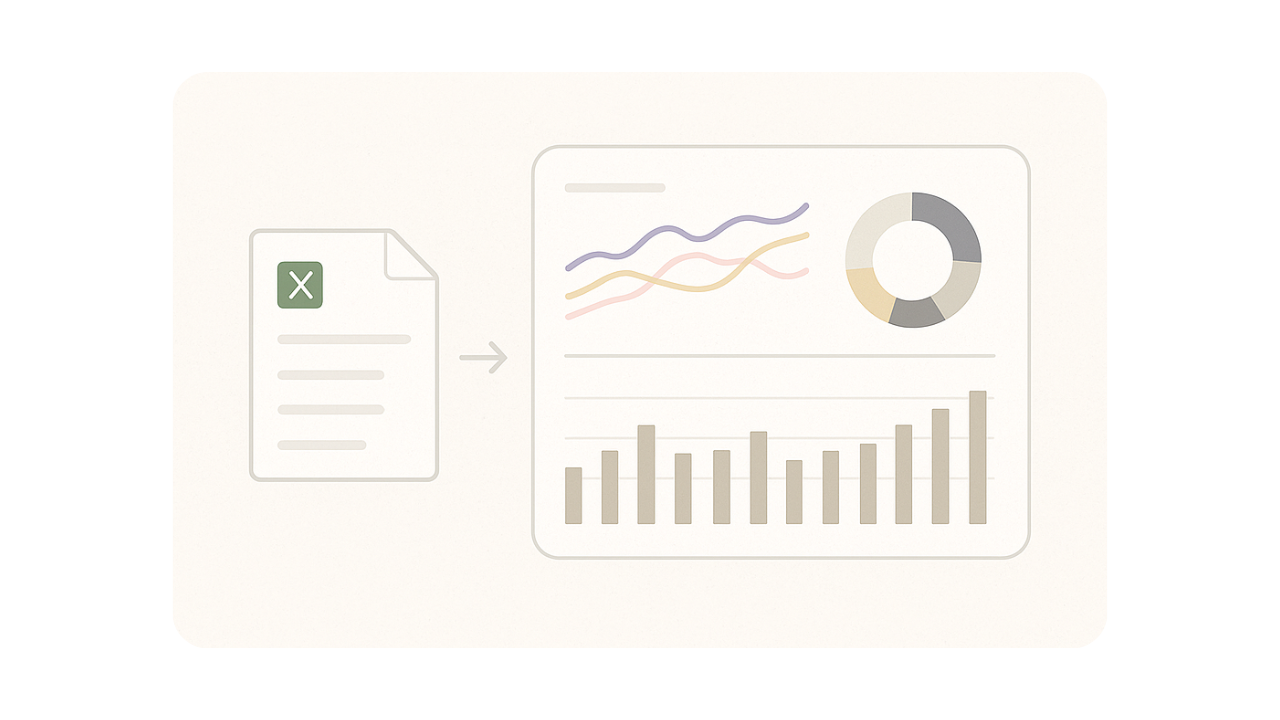
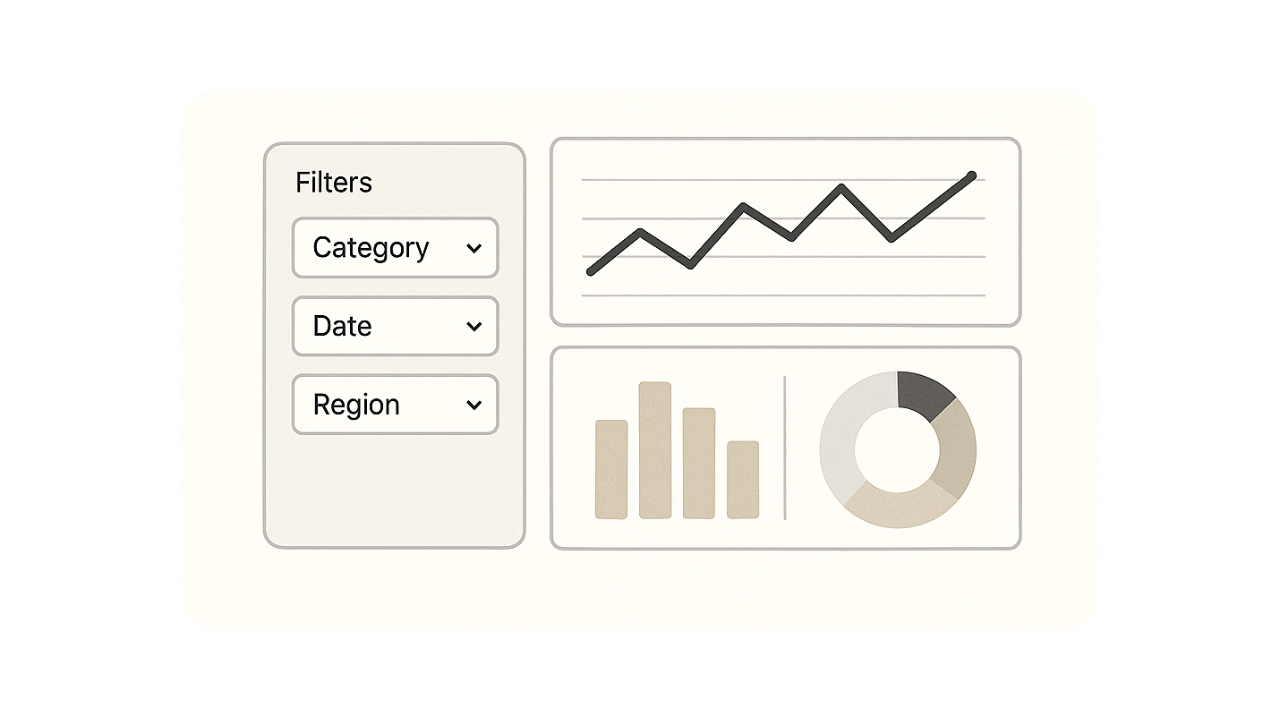
Instant Upload → Dashboard
VizMint automatically detects tables and builds a complete visual dashboard in seconds.
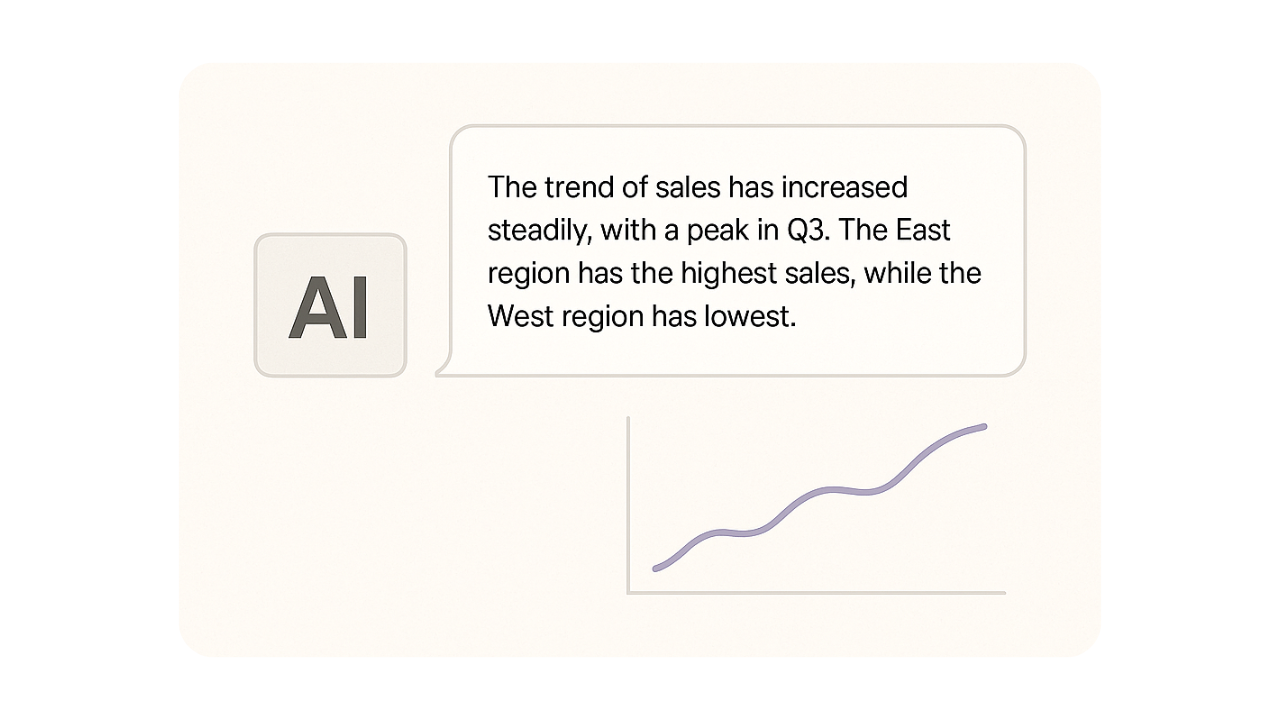
AI-Powered Insights
Get smart, natural-language summaries of trends, patterns, and anomalies.
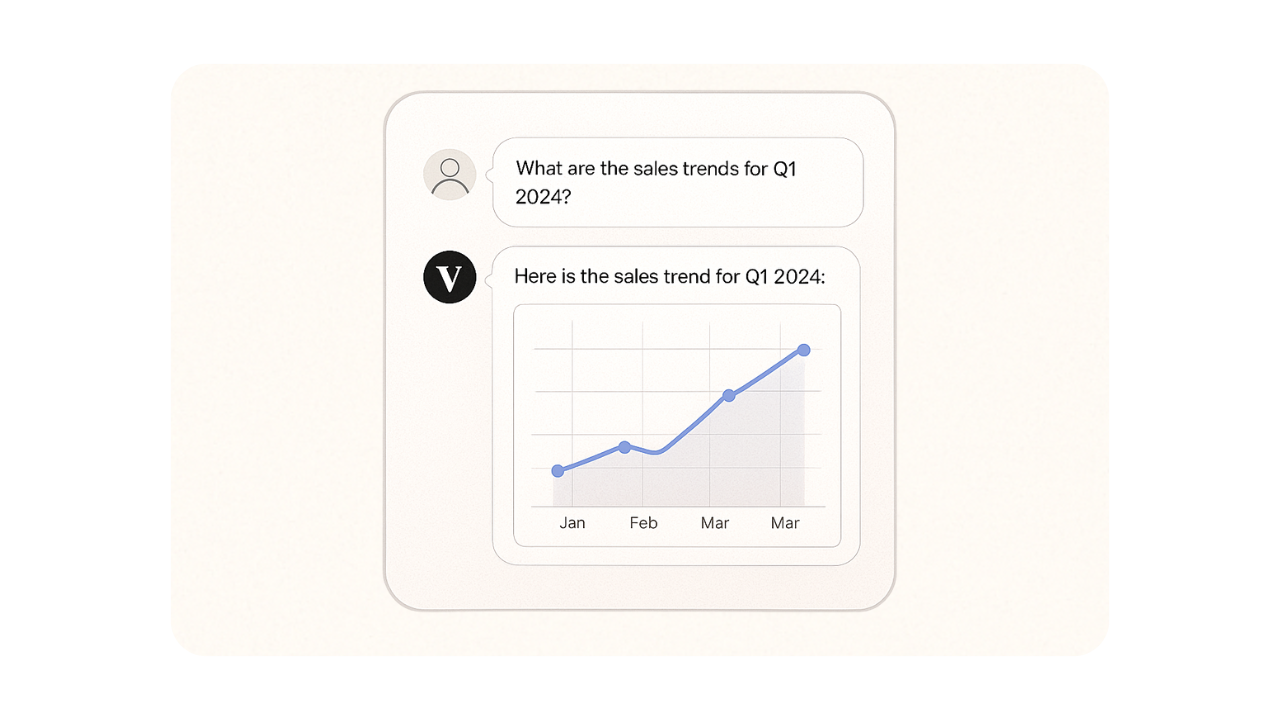
Ask VizMint
Chat with your data to ask questions and get instant charts and answers.
Social Proof
Trusted by Data Teams
Our customers turn hours of spreadsheet work intobeautiful dashboards in seconds.
Acute
Acute
Acute
Acute
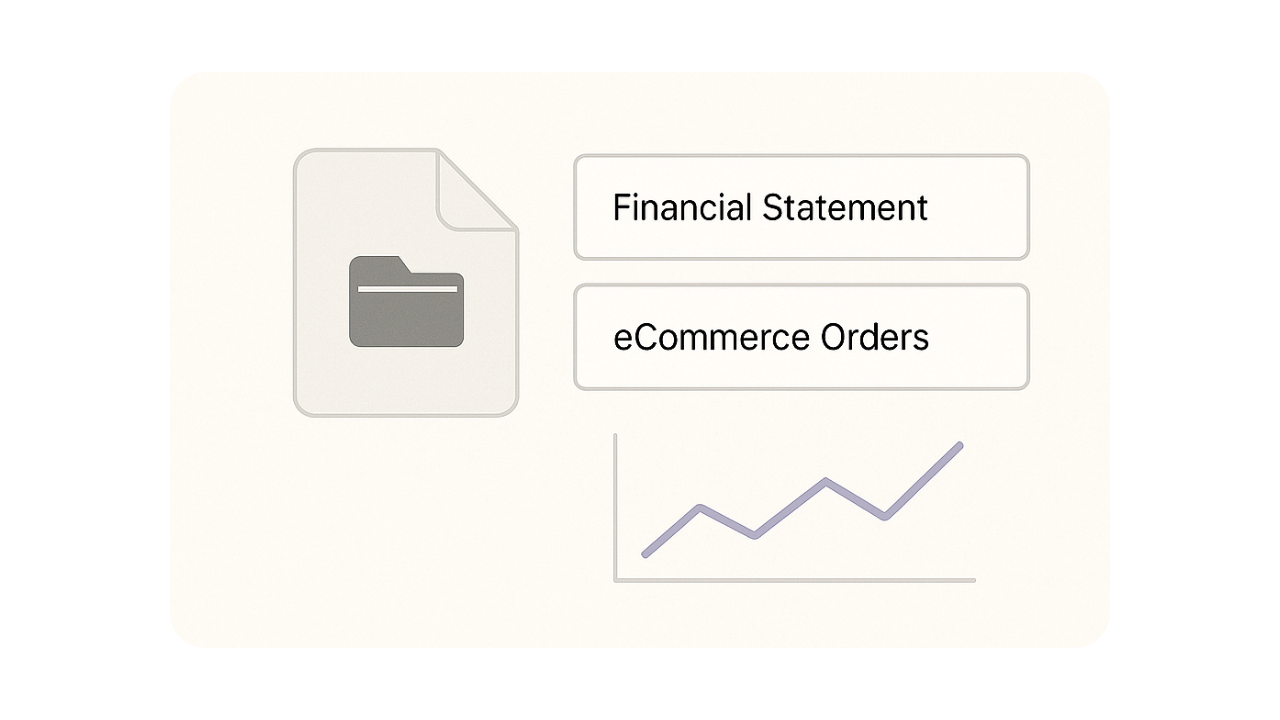
Smart File Understanding
Intelligent file detection for perfect visualization
VizMint detects financial statements, eCommerce data, and more
to automatically generate the most relevant charts for your business.
to automatically generate the most relevant charts for your business.
Smart File Understanding
We detect data types like financial statements or eCommerce orders and build the right dashboard automatically.
Interactive Explorer
Drill down into trends, revenue spikes, and category breakdowns with interactive charts and filters.
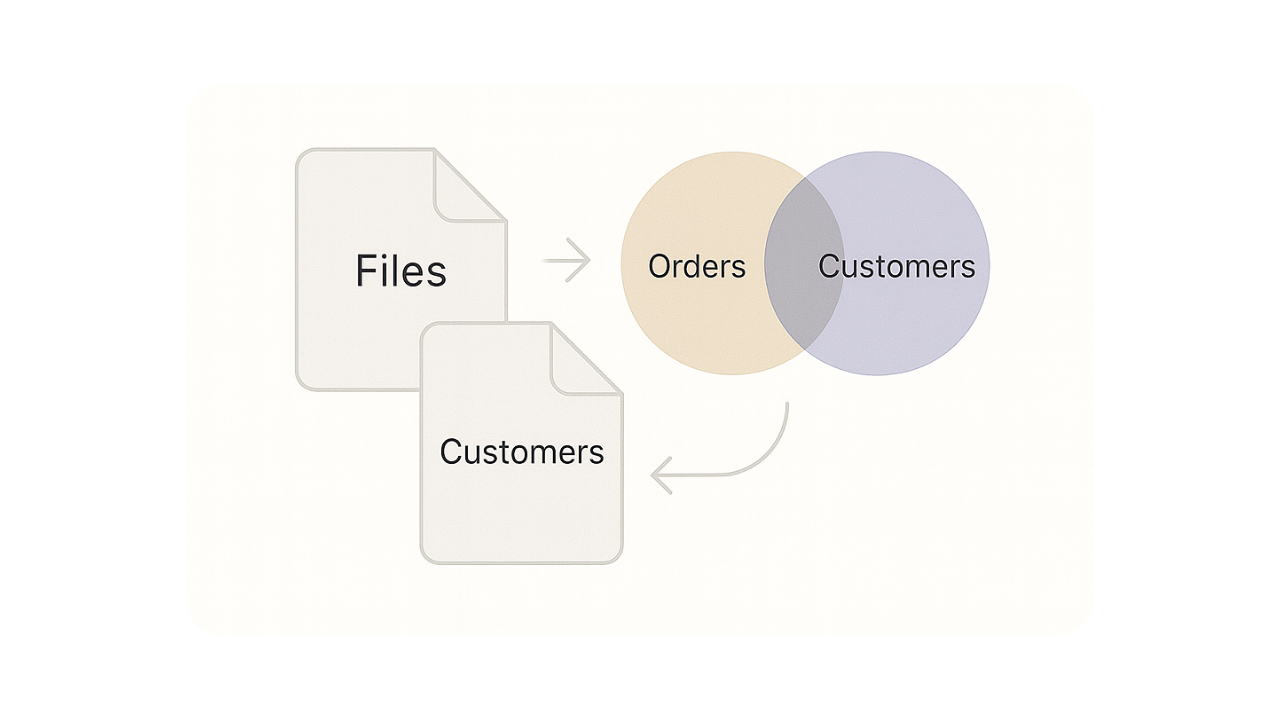
Multi-file Analytics
Upload multiple related files and VizMint auto-detects relationships like "Orders + Customers".
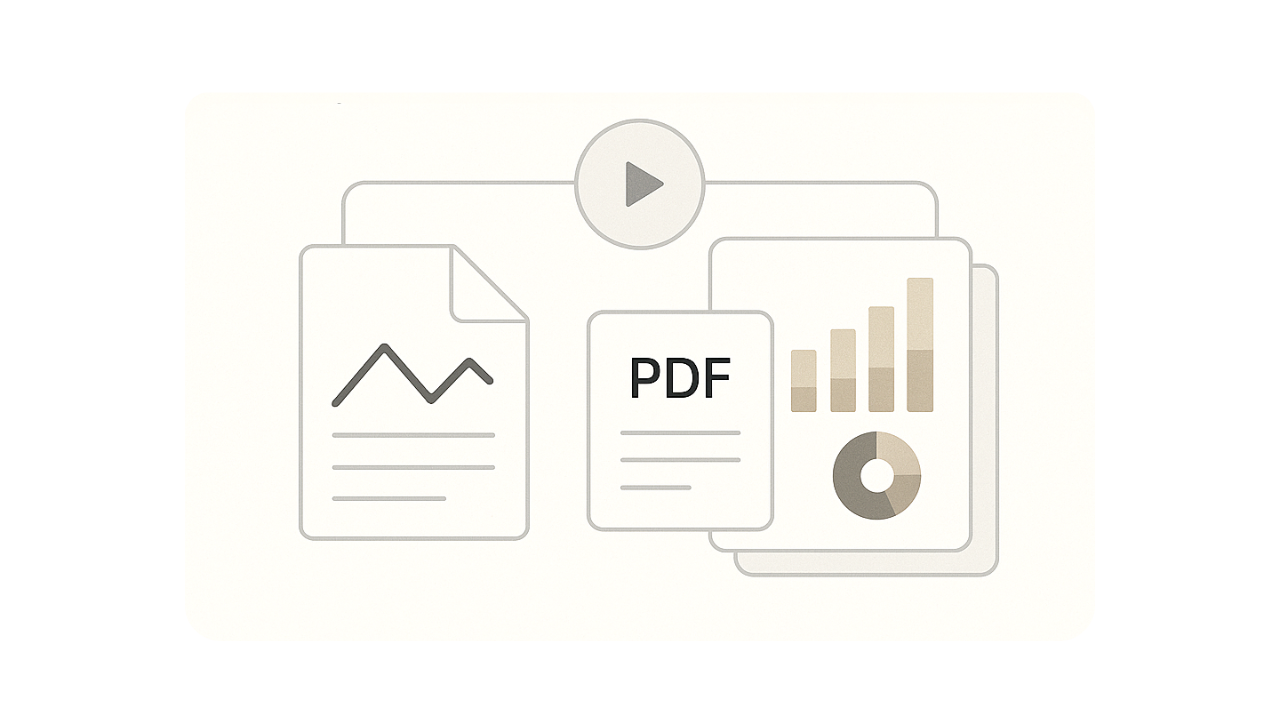
Automated Reports
Generate weekly AI-powered data reports, PDF summaries, and slide decks with just one click.
Platform Features
Streamline your business operations
Manage schedules, analyze data, and collaborate with your team
all in one powerful platform.
all in one powerful platform.
Plan your schedules
Explore your data, build your dashboard,
bring your team together.
Data to insights in minutes
Transform raw data into actionable insights
with powerful analytics tools.
Collaborate seamlessly
Work together in real-time with your team
and share insights instantly.


"We drag in messy marketplace CSVs and VizMint returns clean revenue dashboards in under a minute. Zero SQL, zero setup."
Priya Desai
Ops Lead, Lumen Commerce
Plans & Pricing
Simple pricing for powerful insights
Choose the plan that fits your data needs.
Start for free, upgrade for power.
Start for free, upgrade for power.
1 dashboard generation / day
Up to 5,000 rows
Basic charts
Simple AI summary
No saving exports
Unlimited runs
Up to 500k+ rows
Save dashboards
Export as PDF/PNG
Export code (Python/JS)
Advanced insights & forecasting
Multi-file join/merge
Priority AI reasoning
Everything in Pro Tier
API Access
Automated Reports (Weekly PDF)
Embeddable widgets
White-label mode
Dedicated support
Custom integrations
SLA & Security
Frequently Asked Questions
Everything you need to know about turning your data
into actionable insights.
into actionable insights.
VizMint is an AI-powered platform that turns uploaded Excel and CSV files into clean, interactive dashboards instantly. It's perfect for small business owners, freelancers, agencies, and anyone who touches spreadsheets but isn't a BI expert.
Simply upload your file (Excel, CSV, or Google Sheets export), and VizMint automatically detects tables, infers data types, identifies key metrics, and builds a complete visual dashboard in seconds. No configuration required.
We support Excel files (.xlsx), CSV files, and Google Sheets exports. Our smart file understanding system can detect financial statements, eCommerce data, marketing reports, and more to generate the most relevant charts.
Yes! With 'Ask VizMint', you can use a chat-style interface to ask questions like 'What happened to revenue last quarter?' or 'Which clients are most profitable?'. The system generates answers and charts instantly.
Yes, our Free Tier includes 1 dashboard generation per day with basic charts and simple AI summaries. It's perfect for casual users who need quick insights without any cost.
The Pro Tier offers unlimited runs, support for larger datasets (up to 500k+ rows), the ability to save dashboards, export as PDF/PNG, and advanced insights including forecasting and anomaly detection.
Ready to transform your business?
Join thousands of businesses streamlining their operations,
managing schedules, and growing with data-driven insights.
managing schedules, and growing with data-driven insights.
VizMint
Fresh insights. Crisp dashboards.